One dimensional (1D) inversion of ambient noise data in selected locations of the area of Greece
The implementation of Work Package 3 (WP3) includes the processing of ground (environmental) noise measurements from a special noise array in order to find the best method for estimating the 1D structure expressed in terms of velocities of transverse waves (VS) with depth. First, the scattering curve will be computed from the ground noise data, using different computation methods, such as the HRFK method (Capon et al., 1969) and the WAVEDEC method (Maranò and Fäh, 2013). Then, different combinations of joint inversions, such as the scattering curve and the Rayleigh wave ellipticity, and the transfer function (where available) will be performed to estimate the 1D VS structure. Finally, the results of the 1D VS structures identified will be calibrated against the known geophysical/geological structures (where the structure is known from independent data) to find the best method that minimizes the errors and uncertainties of the estimated structure models.
During the reference implementation period of WP3, a preliminary calculation of the scattering curves using the HRFK method was performed, and also the determination of the HVSR curves for the 11 sites included in WP1. Figure 3.1 shows the indicative HVSR curves for sites KNTXER001e (left) and NESXAN005a (right), which were calculated using the noise data from the central (single-station) seismometer at each site. Figure 3.2 shows in black the result of the scattering curve using the HRFK method for NESXAN005a, while in red the theoretical scattering curve from solving the straightforward problem using the known (from the anastrophe database) geophysical structure model is shown. In solid and dashed black line the lower and upper confidence limits of the scattering are given based on the measurement geometry used (see WP1, Table 1.2).
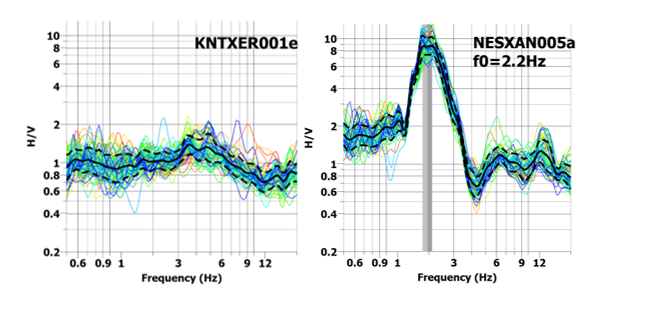
Figure 3.1: Typical example of HVSR curve at background position (left, KNTXER001e) and strong ground motion amplification (right, NESXAN005a) where the ground natural frequency is f0=2.2Hz with maximum spectral amplification amplitude A0HVSR~9.

Figure 3.2 Experimental (black) scattering curve, as determined by the HRFK method using the ground noise measurements from a dedicated seismometer network of the NESXAN005a site, and the theoretical (red) scattering curve from the solution of the direct problem using the known (from the WP1 database) structure model of the transverse seismic wave velocities for this site.
Preliminary inversion processing of scattering curves, for the estimation of 1D VS structure, was carried out on the noise array measurements at the five locations (MEG, SXL, EFR, KTS and FIR) of Santorini. Figures 3.3 and 3.4 show examples of a joint inversion of the scattering curve (left image) with the ground natural frequency (f0=1.2Hz, Figure 3.3 right) and the ellipticity curve of Rayleigh waves (RAYDEC method; Hobiger et al. (2008), Figure 3.4 right). The estimated VS structure from the joint inversion of Fig. 3.3 is given in the left panel of Fig. 3.5, while the corresponding VS structure from the joint inversion of Fig. 3.4 is given in the right panel. In these figures, the experimental curves are shown with black solid lines, while the generated (synthetic) curves from the inversion are given with a colour scale, which corresponds to the error (misfit) between the experimental and synthetic dispersion curves. Each synthetic curve corresponds to a structure model with the corresponding colour.
The estimated geophysical (VS) models in Figure 3.5 with the smallest errors present estimates of the thickness of the overlying pyroclastic deposits in the study area (Santorini) which range between 125 and 160m (VS~600m/sec), over the metamorphic (gneiss-limestone) bedrock (VSbedrock>1500 m/sec), for the case of the joint inversion of Figure 3.3 and 3.4, respectively.
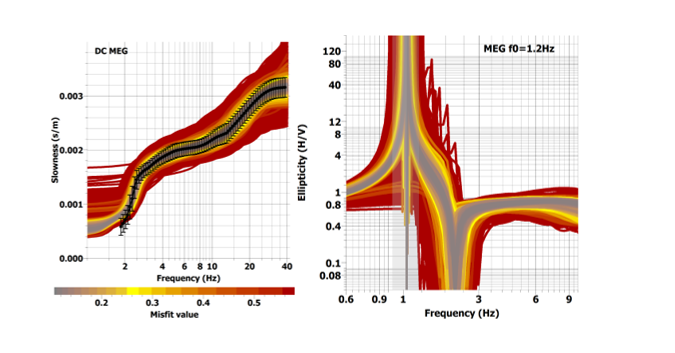
Figure 3.3. Joint inversion of the scattering curve (left) and the eigenfrequency (right, f0=1.2Hz) MEG’s location in Santorini.
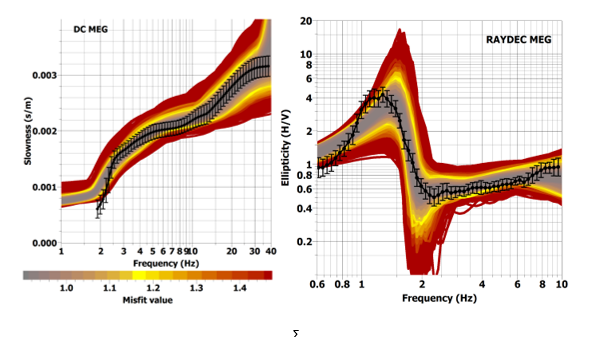
Figure 3.4. Joint inversion of the scattering (left) and ellipticity (right) curves of the Rayleigh waves of the MEG site in Santorini.
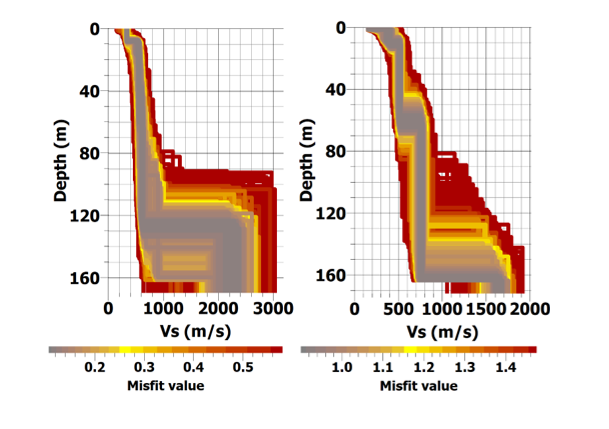
Figure 3.5: Estimated structure models from the joint inversion of Figure 3.3 (left) and 3.4 (right), respectively.
The inversion of Figure 3.4 and the problems it poses led to the investigation of the effect of the joint inversion of the dispersion curve with additional information, both in the WP2 and WP3 context. This process, which is ongoing, aims to identify the optimal inversion of the data. In a first step, the influence on the various experimental quantities estimated from the specific seismometer networks (phase velocity dispersion curves, transfer function, Rayleigh wave ellipticity curve, natural frequency) of local variability of the geophysical structure due to 2D/3D geometry of each site, i.e. deviation from the local 1D model, was investigated. Illustrative results are presented in Figure 3.7, where for a reference structure model both the theoretical curves in blue, as well as the mean curves (black lines) and their uncertainties (dashed lines) from 1000 random models generated based on the theoretical 1D model, assuming a constrained variability due to local 2D/3D geometry, are shown.
The results explain the problem encountered in the joint inversion of Figure 3.4, since the average ellipticity curve (bottom left figure, black line) has a significantly smaller width than the curve corresponding to the theoretical 1D model, which is used in each step of the inversion. Thus, the combinatorial inversion (which theoretically uses the black line) drives the solution away from the real model.
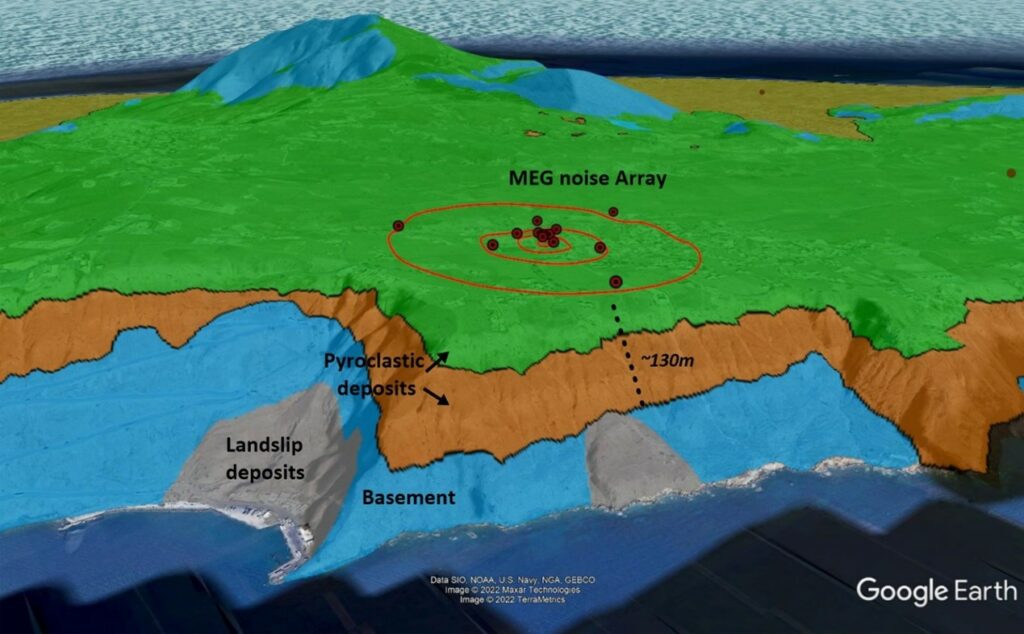
Figure 3.6 Simplified geological mapping of the slopes of the Santorini caldera where the contact of pyroclastic deposits with the metamorphic bedrock is observed. The locations of ground noise measurements from a dedicated network of MEG seismometers (WP1, Table 1) are also given. The geology is modified from Druit et al. (1999).
In contrast, we do not have the same problem in the phase velocity dispersion curves (top left figure) and transfer function (top right figure), where the average synthetic “experimental” curves and the 1D model curve (black and blue, respectively) are practically identical. Based on these results in the present phase, the adjustment of the combinatorial inversion is investigated to be unaffected by this ellipticity curve constraint.
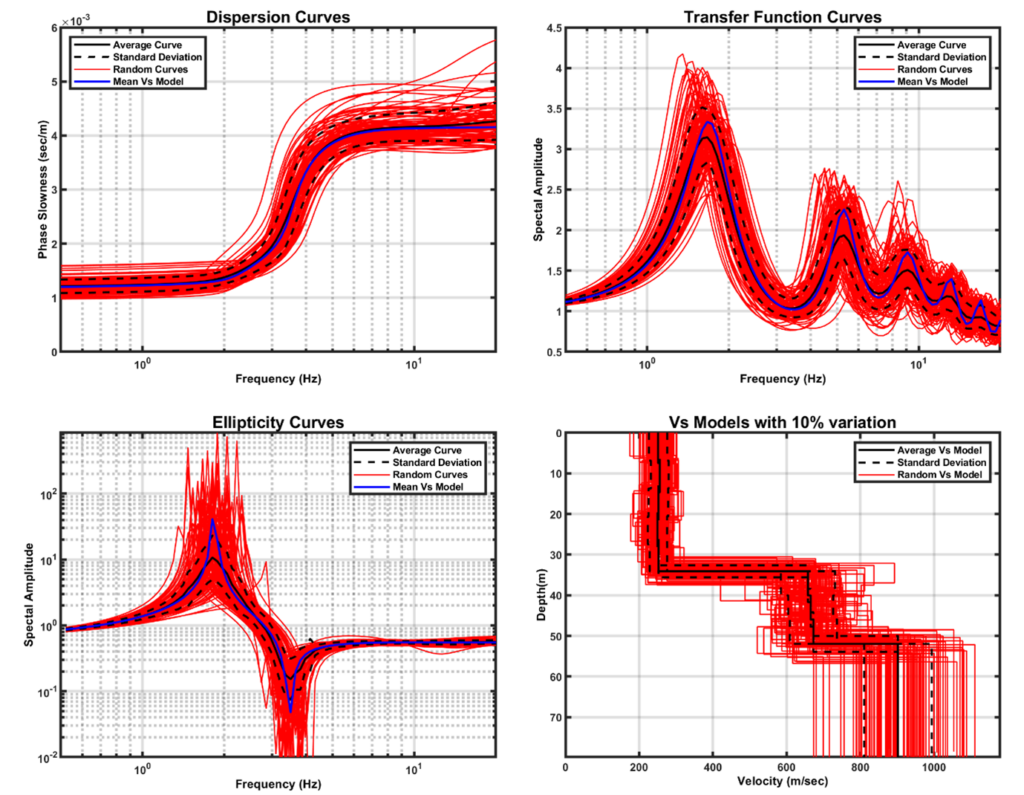
Figure 3.7: Results of the analysis of the effect of the variability of the reference model (due to the 2D/3D geometry of each site) on the phase velocity dispersion curves (top left), the transfer function (top right) and the Rayleigh wave ellipticity curve (bottom left). The lower right figure shows the variability of the average model (2 layers and half-space). In the example, 1000 models generated from the reference model (red curves) have been used, for which the corresponding results are shown in the same colour. The mean models are shown with black solid lines, and the corresponding uncertainties with dashed black curves. Finally, the theoretical models (phase velocity dispersion curves, transfer function, Rayleigh wave ellipticity curve) for the theoretical 1D structure model are shown in blue (see text for details).
In summary, as regards the actions (Tasks) mentioned in the approved TOR for WP3, the following have been implemented:
-
- Pre-processing of data collected in the WP1 to determine data quality
It has been fully implemented for the data collected so far
-
- Determination of phase velocity dispersion curves for Rayleigh waves, as well as HVSR and ellipticity curves from both single station and seismograph network data processing using different methodological approaches
It has been fully implemented for single (single) station data and partially implemented (with a methodology) for seismograph network data. It will be completed with the forthcoming visit of the HR Mr. N. Hatzis to the University of Potsdam to OC member Dr. Matthias Ohrnberger
-
- Theoretical inversion of the Rayleigh scattering curve, both independently, as well as using local structural constraints from the reference database
It has been fully implemented for the data collected so far
-
- Method calibration and comparison of results with a reference database, using both the corresponding 1D models and various commonly used measures (e.g. Vs30, etc.)
It has been fully implemented for the data collected so far. The full evaluation will be made when all the reference data have been collected and interpreted
-
- Investigate the performance of the method and the influence of geology/geophysical structure on the results
To be implemented after the completion of the previous action
New deliverable concerning the combined inversion described in WP3 (WP3), with the additional utilisation of spectral spectral shaking ratios from seismic events (SSR). WP3.3 (D3.3)
References
Capon, J. (1969). High-resolution frequency-wavenumber spectrum analysis. Proceedings of the IEEE, 57(8), 1408-1418.
Chatzis, N., Papazachos, C., Theodoulidis, N., Klimis, N., and Anthymidis, M. (2018a). 1D Vs models by single-station noise data inversion and joint interpretation with independent data. 16th Eur. Conf. Earth. Eng., Thessaloniki, paper 11229, 12pp, accept. for publ., 18-21 June 2018.
Druitt, T. H., Edwards, L., Mellors, R. M., Pyle, D. M., Sparks, R. S. J., Lanphere, M., … & Barreirio, B. (1999). Santorini volcano. Geological Society Memoir, 19.
Hobiger M, Bard P-Y, Cornou C, Le B-N (2009). Single station determination of Rayleigh wave ellipticity by using the random decrement technique (RayDec). Geophys. Res. Lett., 36, L14303, doi:10.1029/2009GL038863.
Maranò, S. and Fäh, D., (2013). Processing of translational and rotational motions of surface waves: Performance analysis and applications to single sensor and to array measurements. Geophysical Journal International, 196(1), 317-339.
Stewart, J. P., Klimis, N., Savvaidis, A., Theodoulidis, N., Zargli, E., Athanasopoulos, G., … & Margaris, B. (2014). Compilation of a local VS profile database and its application for inference of VS 30 from geologic‐and terrain‐based proxies. Bulletin of the Seismological Society of America, 104(6), 2827-2841.