Joint ambient noise tomography
The application of environmental noise tomography methods using specific seismometer networks relies on the cross-correlation of noise recordings, mainly for the generation of scattering curves of surface waves passing through the survey area. The scattering curves contain structural information, allowing the spatial distribution of the velocity (phase or group) of the surface waves to be calculated by means of tomographic inversions. The final 3D geophysical structure model is mainly obtained by inverting (e.g. linear, etc.) the scattering curves on a predefined tomographic grid. Although a significant number of works utilize ground clutter tomography at different scales and geological environments, the limitations in the resolution of the method and the uncertainties arising at several stages of data analysis and processing create significant problems of non-uniqueness and large errors.
The objectives of WP2 are summarised below:
α) Processing of the ground noise data collected by installing dedicated seismometer networks in selected study areas within urban and non-urban (free-field) environments to derive the Rayleigh and Love surface wave group velocity scattering curves, as well as the Rayleigh surface wave ellipticity curves, along each pair of ground noise recording stations of the networks.
(b) Calculation of Rayleigh and Love surface wave travel times for discrete frequency values from the group velocity scattering curves and application of an independent tomographic inversion method to the travel time data for the two types of surface waves.
(c) Application of a combined tomographic inversion method to the Rayleigh and Love surface wave travel time data and adaptation of the procedure using available additional information on the geological, geophysical and geotechnical structure of the subsurface in the respective study areas.
Job Description – WP Objectives Implementation Level
The activities implemented under WP2 in order to achieve the project’s objectives can be grouped into four (4) main stages, which are:
α) Establish an appropriate database of ground noise data collected in WP1,
β)Study of the response of the upper geological formations of the subsurface to ground motion, in the area of the installed special seismometer network within the urban complex of Thessaloniki,
γ) Extraction of Rayleigh and Love surface wave group velocity scattering curves for each pair of ground noise recording stations of the dedicated network,
δ) Calculation of Rayleigh and Love surface wave travel times for discrete frequency values. The following paragraphs describe in detail the work implemented in each of the above mentioned steps.
α) Soil noise database and pre-processing
To manage the large amount of ground noise data collected in WP1, an appropriate database was created. In particular, the set of available ground noise recordings at each station location of the dedicated network was divided into smaller segments, so that each segment corresponds to a time span of one day (24 hours). At the same time, data pre-processing was performed, following the procedure proposed by Bensen et al. (2007). Initially, an appropriate correction for instrument response was applied to all ground noise recordings. The correction was necessary since different types of sensors were used in the data collection (see description previously in WP1). Appropriate filters were then applied to the recordings to obtain homogeneity and reduce the influence of very low as well as very high frequency signals propagating in the specific network region. The most important step in the preparation of the data was their time-domain normalization. The time-domain normalisation of the ground noise recordings is used to suppress the effect of elastic waves due to major seismic events, as well as the action of unwanted anthropogenic noise sources in the vicinity of the dedicated network stations. Finally, spectral normalization was used to remove monochromatic sources, which often appear in the ground noise spectrum.
β) Study of the response of surface geological formations of the subsurface to seismic motion
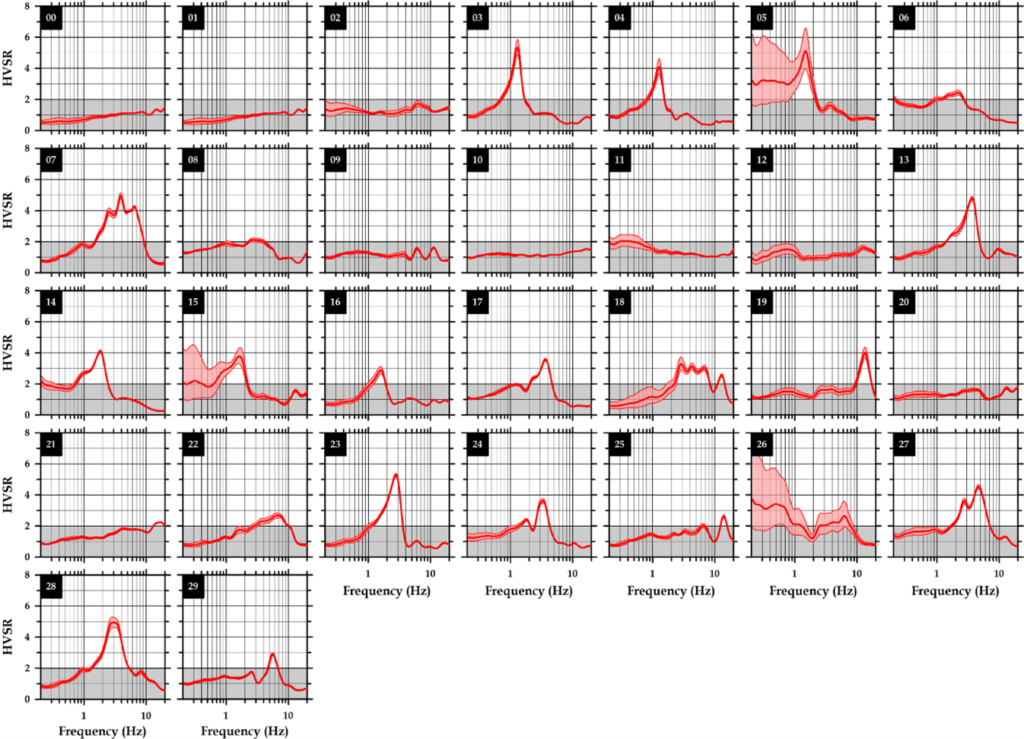
Prior to the derivation of the Rayleigh and Love surface wave group velocity scattering curves from the ground noise recordings, a study of the response of the upper subsurface geological formations to seismic motion was carried out. The response study served mainly to determine the change in the thickness of the surface sedimentary deposits in the study area or, respectively, to determine the depth of the geological basement. In addition, the joint inversion of the response and ground-noise tomography results can contribute significantly to the estimation of more reliable and realistic geophysical models of the subsurface. The study of the response of subsurface geological formations was carried out by calculating the curves of the spectral ratio of the horizontal to vertical component (Horizontal to Vertical Spectral Ratio or HVSR) of the ground noise recordings (Nogoshi & Igarashi 1971, Nakamura 1989, Nakamura 2000) at each station location of the dedicated network. The minimum and maximum frequency values of the HVSR curves were set from 0.2 to 20Hz respectively, covering the interval of greatest geotechnical interest, and their mapping for each site is shown in Figure 2.1.

Figure 2.1: HVSR curves as obtained from the processing of ground noise recordings for each station location of the installed specific seismometer network in the study area (urban centre of Thessaloniki, see WP1). From the (total) local maximum of each curve, the fundamental natural frequency (f0) of the surface geological formations of the subsurface is calculated, as well as a lower limit of the amplification factor (A0) of the ground motion. In curves where no local maximum is observed (constant value of amplitude, around unity), the rocks of the geological background are close to the ground surface or the contrasts in physical and mechanical properties between the geological formations are not significant. The gray area of the plots contains the portions of the curves with spectral widths less than 2, where we assume that there is no statistically significant amplification of ground motion.
Note that the position codes given in the top left of all diagrams are analogous to the codes in Figure 1.1 from WP1. Two key parameters were derived from the maxima of the HVSR curves. The fundamental natural frequency (f0) of the surface sedimentary deposits of the subsurface, and a lower bound on the amplification factor (A0) of the ground motion (Bard et al. 2004, Haghshenas et al. 2008). In cases where the HVSR curves do not show a local maximum and have a flat curve with a spectral width around unity (for example, in the diagrams with position codes 01 and 10 in Figure 2.1), the geological basement rocks are located close to the ground surface or the contrasting


Figure 2.2 Spatial variation of the values of the fundamental natural frequency (f0) of the surface sedimentary formations of the subsurface (top), as well as the amplification factor (A0) of the ground motion (bottom), as obtained from the analysis of ground noise recordings by the HVSR method at the locations of the stations of the installed dedicated seismometer network in the study area. The dashed line corresponds to the surface trace of the contact of the bedrock with recent sedimentary formations.
in physical and mechanical properties between the geological formations of the subsurface are not significant. The spatial distribution of f0 and A0 values are presented in Figure 2.2. From Figure 2.1 and Figure 2.2, high values of f0 are observed in the NE part of the grid, suggesting the existence of the geological background very close to the ground surface, in excellent agreement with the geological information in the study area. On the other hand, low values of f0 are observed in the SW part of the network, which are related to the increasing thickness of sedimentary deposits, as expected from the available geological and geotechnical data.
γ)Extraction of the scattering curves of the Rayleigh and Love surface wave group velocity
The next stage of activities implemented in WP2 was the extraction of the Rayleigh and Love surface wave group scattering velocity curves for each pair of stations of the installed dedicated seismometer network in the study area. To retrieve the surface wave scattering, cross-correlation of the ground noise recordings to the corresponding vertical, radial and transverse components of the ground motion was performed. By cross-correlating the data it was possible to construct part of the Green’s function along the structure mediating between two network stations (Gouédard et al. 2008). However, the correlation curves contained information about a set of surface waves propagating in the network space with different frequencies. Consequently, to extract the group velocity of surface waves at discrete frequency values and construct the scattering curves, it was necessary to apply multiple filter analysis to all the calculated scattering curves.
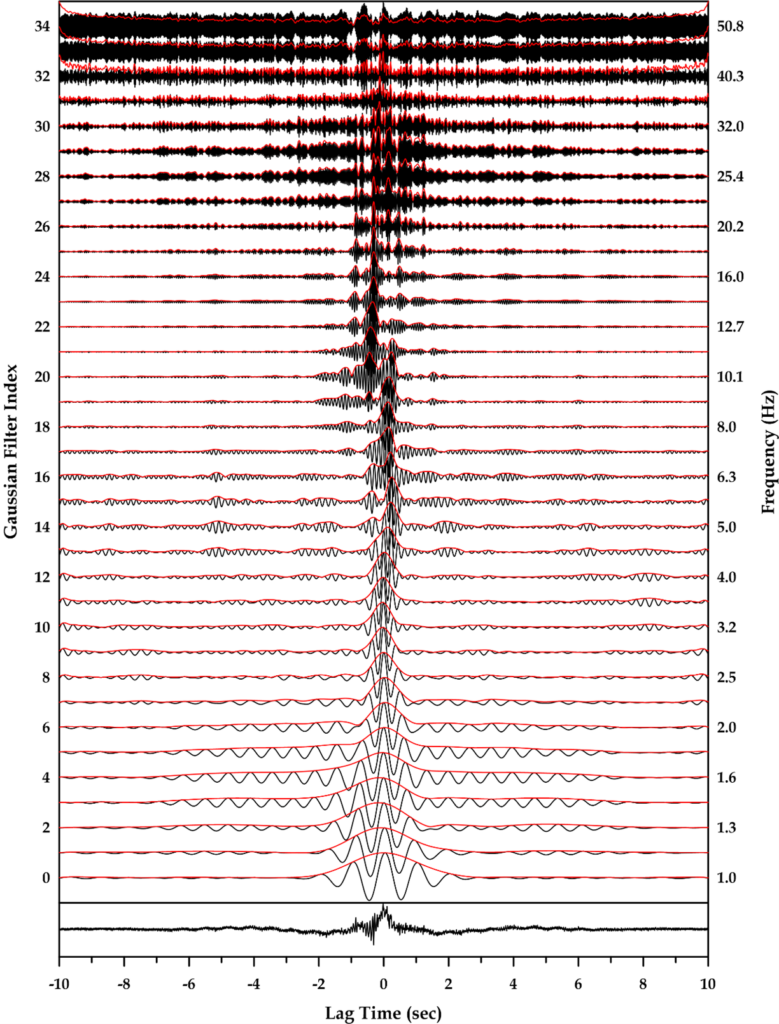
Using the multiple filter analysis (Dziewonski et al. 1969), a total of 35 appropriate, short-range filters were applied to each correlation curve. The filter function followed a normal Gaussian distribution around a central frequency value. The maximum bandwidth of each filter was set at 50% of its central value. The central frequency values ranged from 1 to 50.8Hz and were equally spaced on a logarithmic scale. In each filtered correlation curve the envelope function was calculated, the (total) maximum of which corresponds to the travel time of the surface waves with maximum energy along the respective pair of ground noise recording stations.
An example of the application of the multi-filter analysis to a correlation curve in the study area is shown in Figure 3.3. The mapping of the correlation curve was performed in the lower part of Figure 3.3, and the set of different filtered curves in the upper part, together with the corresponding envelope functions (in red).
From Figure 3.3, we observe two features that were common to the results of the multi-filter analysis in all the available specific network correlation curves, regardless of the ground motion components used. The first feature is that at very low frequencies (less than ~1.6Hz in this example) it is not possible to identify any reliable maximum in the envelope functions, due to limited resolution. In particular, in this frequency range the surface

Figure 2.3: Example of the multi-filter analysis on a correlation curve from a pair of stations of the installed specific seismometer network in the study area (urban cluster of Thessaloniki, see WP1). The correlation curve (bottom diagram of the Figure) presented was obtained by using the vertical components of the ground motion, and is expected to be dominated by Rayleigh waves. The filtered correlation curves have been mapped for each center frequency of the applied filters, together with the corresponding envelope functions (in red).
waves propagate at wavelengths longer than the maximum distance (aperture) of the two recording stations under investigation and not recorded by our network. The second characteristic observed is found at higher frequencies (higher than ~16Hz in this example), where the shape of the filtered intercorrelation curves appear extremely “noisy”. This is due to the inability to retrieve information on surface wave propagation, mainly due to their inelastic damping within the significantly thick sedimentary deposits, and the distance of the dedicated network stations, which limits the shortest wavelength that can be retrieved. In particular, in this frequency range, surface waves propagate at wavelengths less than half the distance between recording stations and are not fully developed.

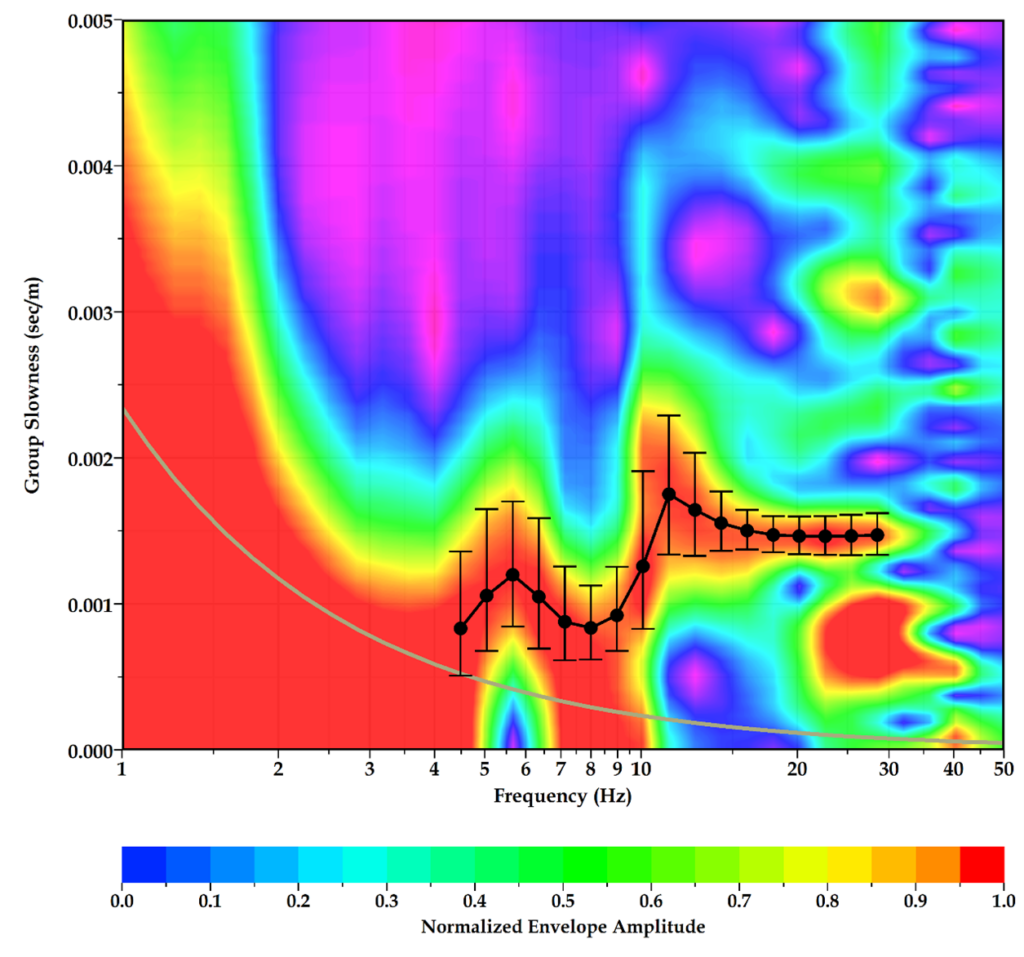
Figure 2.4 Example of converting the results of the multi-filter analysis into a two-dimensional (2D) distribution diagram of the amplitude of the envelope function versus frequency and group velocity of the surface waves. The selection of the Rayleigh surface wave scattering curve (black circles with error bars corresponding to the standard deviation) is done in an easy and graphical way. The grey curve is the lower limit of resolution, which corresponds to surface waves propagating at a wavelength equal to twice the distance of the pair of stations in the dedicated network.
In order to improve the robustness and reliability of extracting the necessary information from the filtered correlation curves, an appropriate transformation of the results of the multi-filter analysis was performed. In particular, the time scale (or time steps) was transformed into a slowness scale (quantity inverse of velocity) of the surface waves using the known distance between the stations of the specific network. It is worth noting that the time scale consists of a negative and a positive part, which correspond to surface waves propagating in opposite directions. Therefore, negative and positive values of the slowness of the surface waves, which have the same physical significance, are obtained in a similar way. To avoid negative values of slowness, the root mean square (RMS) error of the amplitude of each envelope function was calculated from the corresponding negative and positive points. Then, the two-dimensional (2D) distribution of the root mean square amplitude over the frequency-slowness plot was calculated by applying an appropriate interpolation method to the data values. Thus, the construction of the surface wave scattering curve for each pair of ground noise recording stations of the specific network was performed in an easy and graphical way, tracing the maximum RMS values at each frequency. At the same time, it was possible to calculate the standard deviation of the scattering curves, since the graphical distribution of RMS provided the range of surface wave energy on the slowness scale. Figure 2.4 shows a typical example of the above process of converting the results of the multi-filter analysis and selection of the Rayleigh surface wave scattering curve for a pair of dedicated network stations in the study area. In addition, in all the plots constructed (one for each pair of recording stations), the lower limit of resolution on the plots was also mapped, which corresponds to the propagation of surface waves with wavelengths longer than twice the distance between the pair of special network stations (grey curve).
δ)Calculation of surface wave travel times
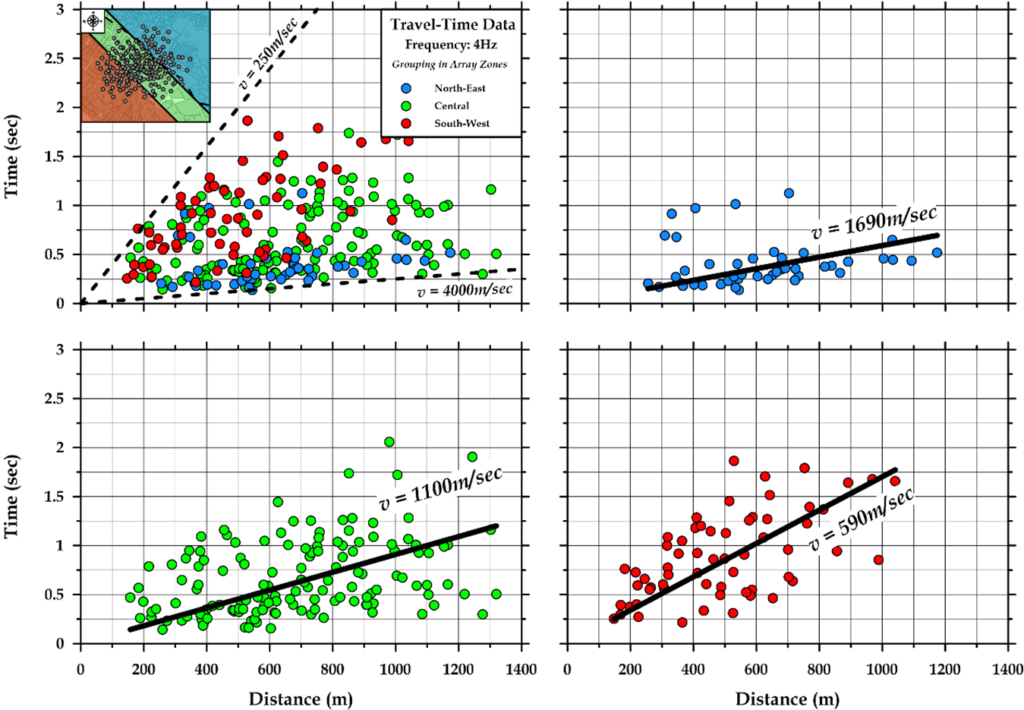
The scattering curves constructed for each pair of ground noise recording stations of the dedicated network in the study area contained the necessary information to calculate the Rayleigh and Love surface wave travel times at discrete values of frequency. An example of the calculation of Rayleigh surface wave travel times for both the 4Hz frequency is shown in Figure 2.5.
Figure 2.5a shows a general increase in travel times as a function of distance, but with quite a large variation in the data values. As an indication, at a distance of 300m, the values of travel times range roughly from 0.2sec to 1.1sec, i.e. almost from 270 to 1500m/sec. This fact reveals the presence of strong lateral variations in surface wave velocity in the study area, which is expected based on the available geological and geotechnical information. To investigate the influence of the subsurface structure on the surface wave travel times, the study area was divided into three parallel zones of NW-SE direction (see also inset map in Figure 2.5a). The first zone in its NE part (blue in the inset map in Figure 2.5a), includes the occurrence of geological basement rocks at or very close to the ground surface.

Figure 2.5. Calculation of Rayleigh surface wave travel times for 4Hz frequency in the study area and grouping them into three zones (see inset map in case a) with different geological conditions. a) distribution of all available data, b) data from pairs of ground noise recording stations in the NE section of the installed dedicated seismometer network, c) data from pairs of stations in the central zone of the network and, d) data from pairs of stations in the SW section. In cases b), c) and d) the least-squares line passing through the origin of the axes has been fitted to the travel time data, while in case a) the dashed lines correspond to the velocity range of the total data.
The second zone extends in the central part of the study area (green in the inset map of Figure 2.5a), where it represents the lateral transition of the basement formations to the SW and is probably characterized by significant gradients of the subsurface layers. Finally, in the third zone in the SW part of the area (red in the inset map of Figure 2.5a), an increase in the thickness of sedimentary deposits and a decrease in surface wave velocities are expected due to their propagation through geological formations with reduced cohesiveness (looser sediments).
Figures 2.5b to 2.5d show the results of the above clustering of Rayleigh surface wave travel times for the frequency of 4 Hz. The data are plotted with different color scale depending on the band to which they belong. In the NE part of the study area (Figure 2.5b) a linear trend of the data is observed with a relatively small dispersion of travel times, while the slope of the least squares line fitted to the data (assuming that at zero distance the surface wave travel time is also zero) shows that the surface wave velocity approaches the value of 1690m/sec. Similarly, in the SW section (Figure 2.5d), the linear trend is evident, but with a larger dispersion of the data. The surface waves propagate through the looser sedimentary deposits in this zone with a group velocity of 590m/sec.
In the central zone of the study area (Figure 2.5c) the geological structure is likely to be rapidly changing on a very local scale. This leads to a fairly large dispersion of travel times, since the data come from pairs of logging stations in the specific network that are affected by different geological conditions. Part of the data corresponds to surface waves whose velocity is determined by the presence of geological background at a shallow depth from the ground surface. On the contrary, in the area close to the boundary with the SW zone, the velocity of surface waves decreases due to the increasing thickness of the sediments. The average velocity in the central zone practically represents the average of two extreme zones (in the NE and SW), approaching 1100m/sec.
The above preliminary calculation of surface wave travel times and their grouping into zones with different geological conditions reveal the compatibility of the results with existing geological, geophysical and geotechnical studies for the area of interest. Furthermore, it is an important indication that the application of the tomographic approach to the assessment of the surface geophysical structure of the subsurface is suitable to lead to the identification of lateral layer transitions.
The activities to be implemented in WP2 in the next period are summarised below:
-
- Application of a tomographic inversion method to travel time data to determine the spatial variation of Rayleigh and Love surface wave group velocity in an urban environment.
-
- Construction of local scattering curves for the two types of surface waves at the node locations of a preselected tomographic grid in the study area.
-
- Independent one-dimensional (1D) inversion of local surface wave scattering curves to estimate the distribution of transverse elastic wave velocity (Vs) with depth.
-
- Theoretical design and study of the combined 1D inversion of the Rayleigh and Love surface wave scattering curves under the condition of an isotropic elastic wave propagation medium and the use of specific anisotropy constraints on the transverse component of the ground motion. Results are checked with synthetic (without errors) and pseudo-realistic (with errors) synthetic data.
-
- Adaptation of the data inversion methodology to incorporate Rayleigh wave ellipticity as derived from single station ground noise data analysis.
-
- Application to networks in urban and non-urban environments and creation of proposed methods for collecting and adapting ground noise tomography as appropriate.
In summary, as regards the actions (Tasks) mentioned in the approved TOR for WP2, the following have been implemented:
-
- Pre-processing of data collected in WP1, to determine the quality of the data, determination of cross-correlation functions and local HVSR curves
It has been fully implemented for one specific network (urban environment, city of Thessaloniki) and will be implemented for the second specific network (peri-urban environment, Mygdonia basin).
-
- Determination of group velocity dispersion curves for Rayleigh and Love waves, and generation of frequency-dependent travel time data. Tomographic inversion of the travel times to determine the spatial distribution of the group velocity
The determination of the group velocity has been implemented for one specific network (urban environment, city of Thessaloniki) and will be implemented for the second specific network (peri-urban environment, Mugdonian basin), when the corresponding measurements are implemented. The tomographic inversion has been performed for part of the data and the results have been submitted for publication in the BSSA journal.
-
- Reconstruction of independent local group velocity (1D) dispersion curves for both surface wave types and independent data inversion
It has been implemented for part of the Rayleigh wave data for one specific network (urban environment, city of Thessaloniki) and will be implemented for the second specific network (peri-urban environment, Mygdonian basin).
-
- Theoretical formulation and investigation of the joint inversion of Rayleigh and Love wave scattering curves assuming isotropic medium and specific transverse anisotropy constraints. Test with synthetic (error-free) data and with pseudo-realistic (errored) synthetic data.
Analytical simulations of joint inversion for 2 and 3 layer models have been performed, with (and without) the use of a transverse anisotropy factor. Inversions will be continued to select the appropriate inversion scheme.
-
- Adjustment method to account for the inclusion of Rayleigh wave ellipticity in the inversion, as derived from single station determinations
Analytical simulations of joint inversion for 2- and 3-layer models have been performed, with simultaneous inversion of the dispersion curve, ellipticity and transfer function. Results are presented in the next section of the paper (WP3). Inversions will be continued to select the appropriate inversion scheme.
-
- Application to both peri-urban and urban clusters and proposal for data acquisition and method adaptation for each case.
It will be implemented after the completion of the two previous actions
References
Bard, P.-Y., & Participants. (2004). The SESAME project: An overview and main results. 13th World Conference on Earthquake Engineering, 1-6 August, Vancouver, Canada.
Bensen, G. D., Ritzwoller, M. H., Barmin, M. P., Levshin, A. L., Lin, F., Moschetti, M. P., Shapiro, N. M., & Yang, Y. (2007). Processing seismic ambient noise data to obtain reliable broad-band surface wave dispersion measurements. Geophysical Journal International, 169(3), 1239–1260.
Dziewonski, A., Bloch, S., & Landisman, M. (1969). A technique for the analysis of transient seismic signals. Bulletin of the Seismological Society of America, 59(1), 427–444.
Gouédard, P., Stehly, L., Brenguier, F., Campillo, M., Colin De Verdière, Y., Larose, E., Margerin, L., Roux, P., Sánchez-sesma, F. J., Shapiro, N. M., & Weaver, R. L. (2008). Cross-correlation of random fields: Mathematical approach and applications. Geophysical Prospecting, 56(3), 375–393.
Haghshenas, E., Bard, P. Y., Theodulidis, N., Atakan, K., Cara, F., Cornou, C., Cultrera, G., Di Giulio, G., Dimitriu, P., Fäh, D., De Franco, R., Marcellini, A., Pagani, M., Rovelli, A., Savvaidis, A., Tento, A., Vidal, S., & Zacharopoulos, S. (2008). Empirical evaluation of microtremor H/V spectral ratio. Bulletin of Earthquake Engineering, 6(1), 75–108.
Nakamura, Y. (1989). A method for dynamic characteristics estimation of subsurface using microtremor on the ground surface. In Quarterly Report of Railway Technical Research Institute (Vol. 30, pp. 25–33).
Nakamura, Y. (2000). Clear identification of fundamental idea of Nakamura’s technique and its applications. 12th World Conference on Earthquake Engineering, 30 January – 4 February, Auckland, New Zealand.